


The Debt Dilemma
The Debt Dilemma
A depiction of truth covering the problems existing within global financial system. A new financial paradigm shift.

Hello and welcome to NeuroInvest Analytics - This blog will be covering the problems existing in our global financial system. A short disclaimer - I am a student of economics. I am not qualified to give financial advice. I am here because my fascination and obsession has led me to very credible researchers which I have found to be objective, open-minded and critical of their work. Now I want to share this collection of research with you.
Let’s begin! - A new financial paradigm
We are currently witnessing a new paradigm shift in the global financial system. The amount of government debt relative to GDP has historical parallels only comparable to the 1940’s (figure 1.0). Take a look at the graph below to demonstrate this very pivotal moment in history. Figure 1.0 demonstrates the accumulation of debt relative to the feasibility of servicing that debt through ‘real’ economic growth.
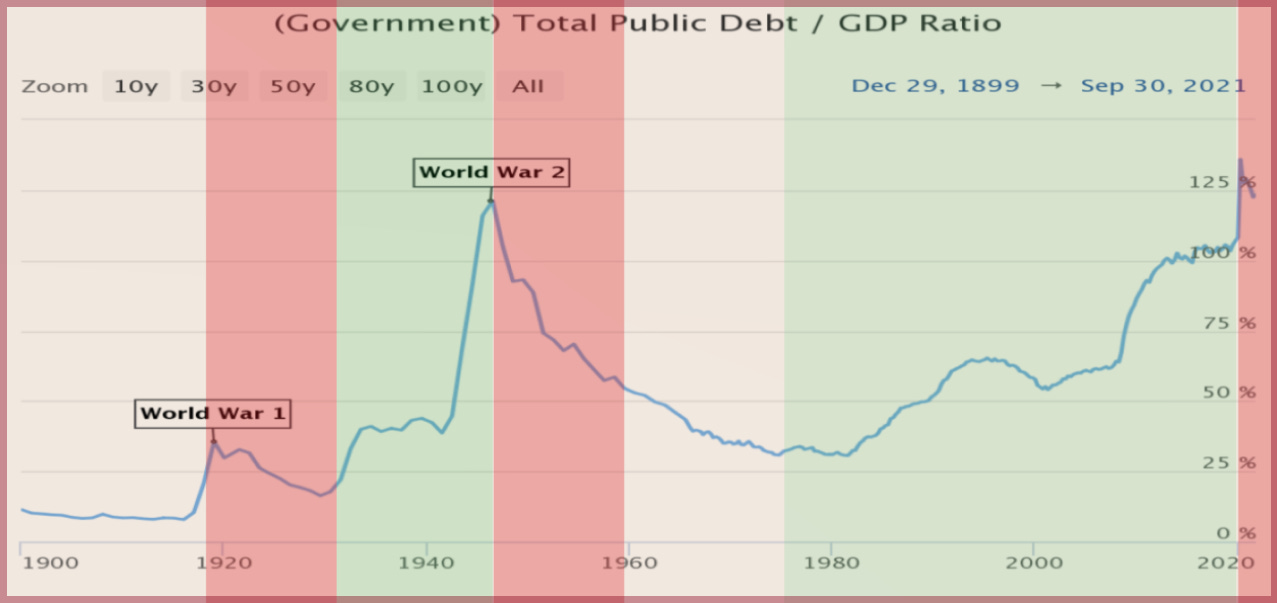
“When debts go above a certain percentage of income and become recognized as unserviceable, these entities either default and go through a bankruptcy/restructuring process, or become beholden to external creditors in order to remain solvent. Having high debt levels relative to GDP is therefore quite a serious problem.”
(Lyn Alden, 2022)
Two questions come to mind - how did the U.S get this far in debt, and what are the implications of this on our economic state?
Early on Ray Dolio warned of this long-term debt bubble, but how did this mathematical flaw in our system persist over time without any proper treatment? To understand the mechanical underpinnings of this monetary system, we have to dive into how the system works - the mechanics.
Let’s start off by introducing the ‘headliners’ of the financial system - one being the Federal Reserve (FED) and the U.S Treasury. Most people know the federal reserve as central bankers in-charge of money printing. In actuality, what the FED does is create large based asset purchases (LSAPs), an instrument which enables swapping bank reserves for assets at a large scale.

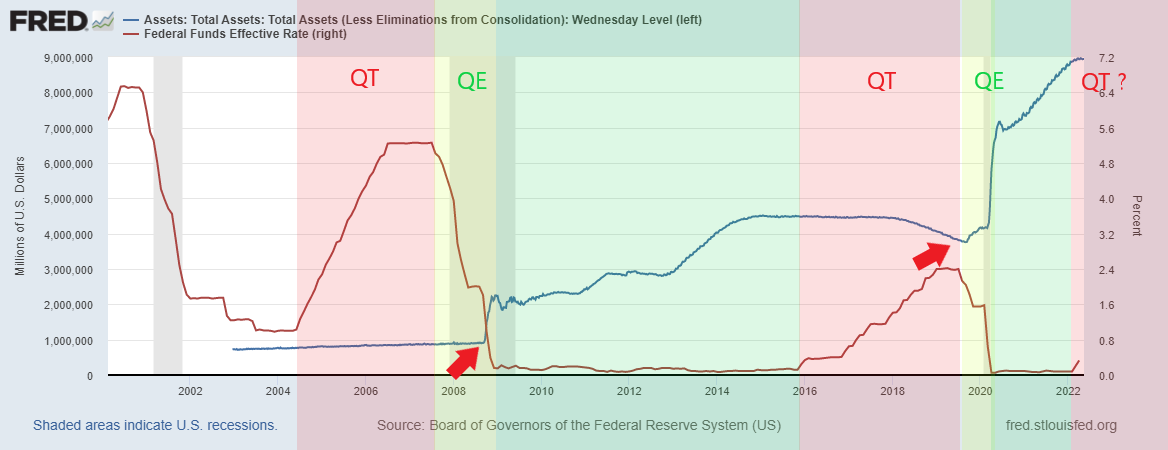
Figure 2.0 - Quantitative easing (QE), one form of these policy tools where the FED purchases assets more aggressively (figure 2.0 in blue) - a strategic instrument to lower the cost of credit, which incentivizes borrowing/lending and is primed to stimulate economic growth. Conversely, instead of ushering cyclical growth trends, the low-cost credit methodology has not corresponded to any of its primary obligations.
In fact, “QE has had nothing to do with providing ‘real cash’ to the private sector, which is largely driven by bank lending and government deficits” (Peccatiello, 22). This '“cash” created out of thin air ends up remaining inherent to the banking system. QE increases base money (figure 2.0 in blue) but has very limited ways to trickle down to the private sector (expand broad money supply).
Let’s take a look at why the FED believed the formality of QE to begin with.
In the 2000’s, just prior to the great recession U.S banks were extremely over-levered with marginal monetary defensiveness to their balance sheet - they essentially had less protection in case of default. At the time when turmoil had reached a pivotal turning point, U.S banks were holding risky assets and loans.
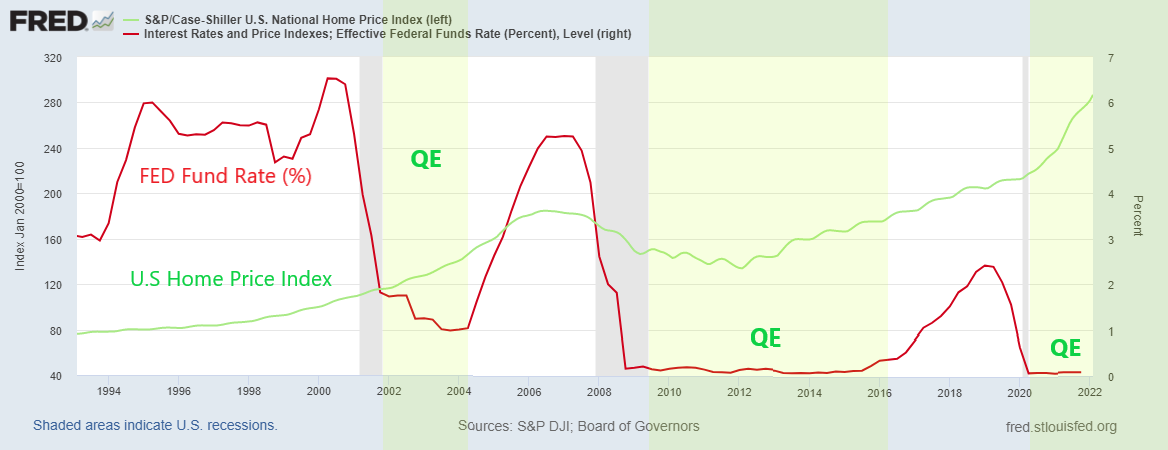
Just before the great recession, lenders were allowing subprime borrowers to take loans and cheap “cash” with overtly lax financial regulations. The low interest rates inadvertently caused home prices (Figure 3.0 - green line) to flourish as demand for the cheap credit outpaced supply. Because there were little conditional regulations for banks to buy assets and risky instruments, they allowed the financial sector to reach the pressure point of credit utility.
Borrowers were stuck with mortgages they could not afford and the chain reaction caused a massive U.S housing bubble. This not only affected the American households net worth by $16 trillion according to Britannica, but the seismic waves also had repercussions globally.
Duct Tape the Broken Pipes (The Aftermath)
In response to this great financial crisis, commercial banks are now, by regulation, forced to own High Quality Liquid Assets (HQLA). This is a risk management strategy used in situations when banks become threatened by insolvency (liquidity/credit constraints).
Using this intuition, the regulators wanted to increase the requirements to own more reserves; a defensive strategy to create stability in bankers balance sheet (Portfolio Rebalancing Effect). The FED essentially created reserves out of thin air and gave them to banks in exchange for treasuries (e.g. Mortgage back securities, bonds, etc.). As mentioned previously, the general problem with the methodology in the first place, is that QE has very few transmission methods to reach the private sector (QE expands base money > Broad money).
So where does that money end up if not to the private folk?
Commercial banks are on the receiving end of these bank reserves - but the reserves are suboptimal assets to own. At this point, all we need to know is that they have inherently limited monetary utility for banks and they provide very few ways to finance the private sector. As a result, the reserves are ultimately exchanged for the sole purpose of security and the Portfolio Rebalancing Effect.
If you want to read about the portfolio rebalancing effect in depth, Alfonso dives into the rabbit hole of reserve vs treasury anatomy on substack (The Macro Compass - The True Reason Why Central Banks Do QE)
Given that the bank reserves have little to no utility, the commercial banks as an example perform the action of swapping their reserves for more liquid instruments (e.g. bonds and stocks), under the conditional acceptance of the HQLA code.
Now, during QE you have both central and commercial banks buying bonds and treasuries which accommodate the global network sentiment of risk exposure. In layman’s terms: QE = cheap credit = increased leverage = increased risk appetite. The problem is twofold - firstly, both commercial and central banks are burying themselves in credit simultaneously causing supply constraints in yield generating instruments. Secondly, numbers go up, but primarily for those who are able to take advantage of the liquidity; which is the primary determinant of what is known as the wealth effect. The determining factor as to where the liquidity ended up through QE after the great financial crisis.
Feast your eyes on figure 4.0 - S&P 500 during the period of QE after the financial crisis.
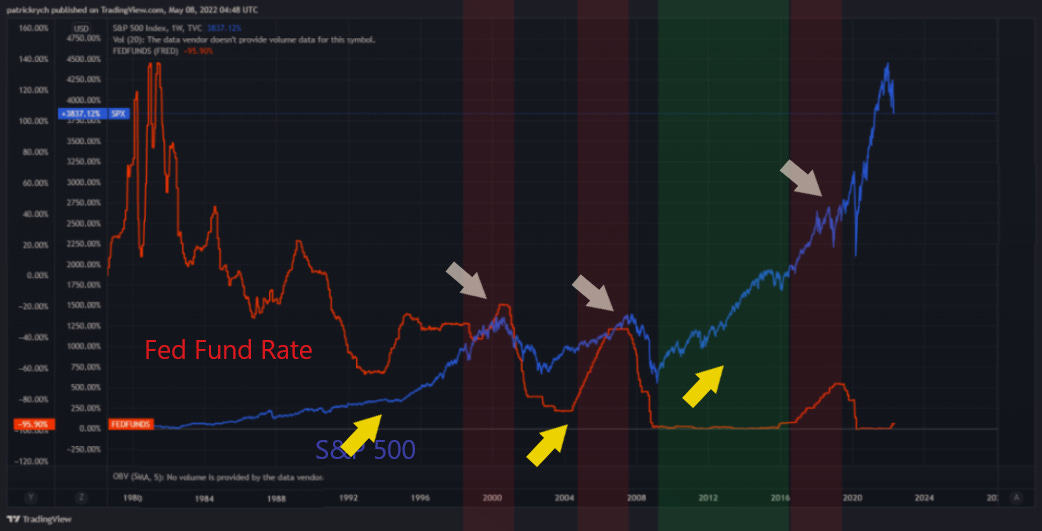
By virtue, QE should kick start demand and hold inflation expectations and cost-push factors constant. However, given these lackluster transmission mechanics along with the last couple decades of a multiple economic constraints, the FED is now stuck in a corner. QE inflated asset prices, but had little effect on economic growth.
During the unexpected events in 2020 (COVID), the neglectful overleveraged system which benefited the top % of the wealthy needed shift the gears and fund the private sector. - A desperate drive to bail out the economy. Since the private sector was neglected and the waterfall of liquidity had provided little value to the bottom of the economy, our policies once again turned the knob for money printing.
In contrast to the recessionary climate of ‘08, the banking system in 2020 was not the culprit of maximum leverage. In fact, it was the broader economy that faced the impeding credit crisis. As a result, the FED had administered a bailout stimulus program to the private sector.
How did they fund the private sector?
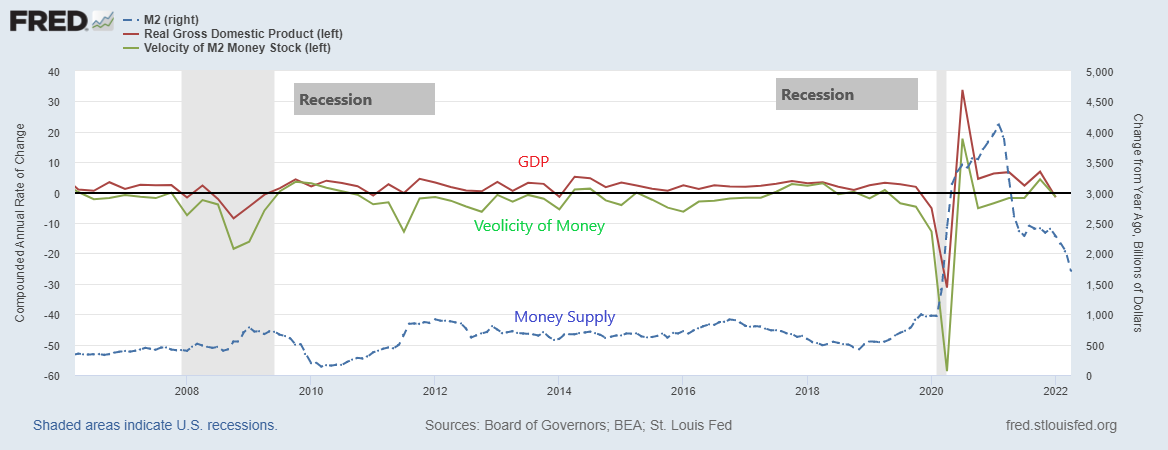
Through QE - or what you know now as large scale asset purchases. So to fund the private market we witnessed not only a large surge in m2 (figure 5.0 - blue) but also an increase in bank reserves to finance the market. With those two factors in mind, the likelihood of higher inflationary prints was already brewing for a storm, but let us not forget the pressing economic uncertainties that drive real economic growth and service the historic accumulation of debt.
According to Friedman,“one could not find inflation anywhere in the world that was not caused by a prior increase in the supply of money or in the growth rate of the supply of money.” (Henderson, 2021).
M×V=P×Y
To see why we are experiencing these persistently high inflationary prints, let’s reflect on the mathematical assumptions Friedman proposed. The symptomatic economy caused policy makers to provide relief through m2 Surge - just in 2020 exceeding 20% yoy. The growth component on a secular and cyclical level have been hindered tremendously by labor demand, supply bottlenecks, geopolitical problems, historic debt levels etc., and we had a large increase in base money to finance the splurge. What were the deterministic events that followed? I can explain by one slow motion GIF:

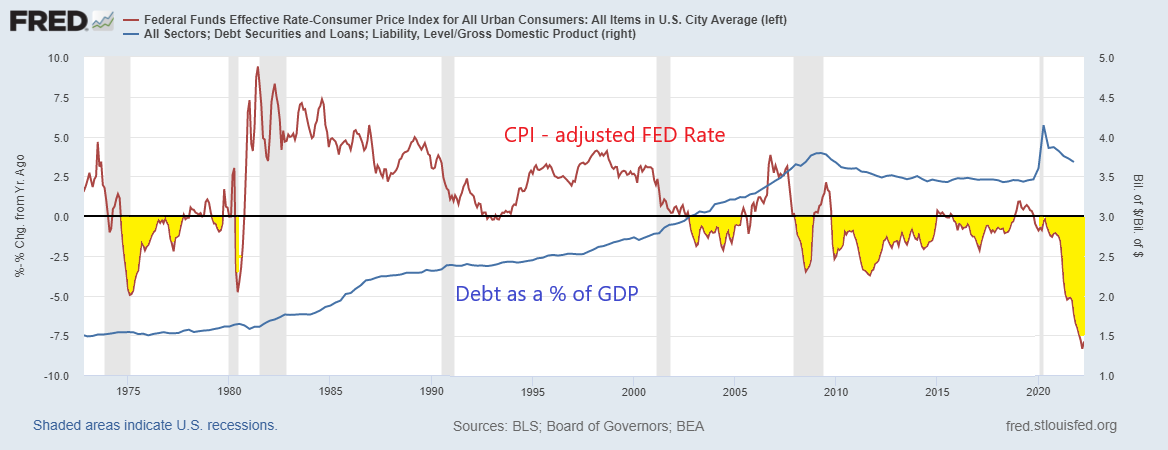
Today, the globe is experiencing events that unfold through the decisions of poor policy management - and a very difficult scenario to fight the high inflationary prints. Which is why many economist believe we are brewing for a stagflationary decade; by definition this is a combination of high inflation and low, zero, or negative economic growth. The graph below (figure 6.0) depicts the Fed Fund Rate adjusted for inflation (CPI). When highlighted in yellow, it is demonstrating the spread between the two variables (distance between inflationary prints and interest rate targets).
The almost parallel circumstances - the 40’s. But, this time it is different.
As mentioned in the start, the only other time we have witnessed these unprecedented levels of debt relative to GDP was in the 40s. However, at that time the FED held rates at zero while attempting to peg the treasury yield at 2.5%, and inflation exceeded 15% prints year over year.
Today, if the FED decided to combat inflation by raising rates to 8%, the entire system would collapse. The amount of indebtedness in combination with all the economic growth constraints would create the big bang of all recessions.
The rise of debt is conditioned into our Fiat and credit based system. Interest rates have historically moved lower to service the rise of debt. This is necessary if the economy has been as slow as it is - incrementally lowering interest rates to offset the exponential rises in the cost of living.
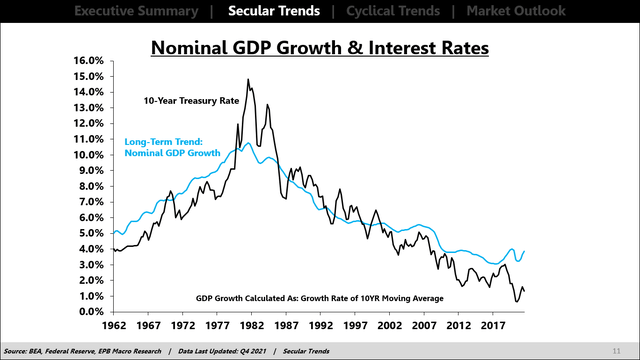
The credit system can work only if real productive growth takes place. In a fantastic article, Eric Basmajian of EPB Macro has conceptualized the secular trends of nominal long-term interest rates. The behavior of these policy tools (QE / QE) is governed by “the long-term direction of growth and inflation or nominal GDP growth” (Basmajian, 2021). As depicted in the graph below, there has been a lackluster nominal GDP growth rate for many reasons: Demographics, Labor force growth, Real per capita growth and more (Figure 7.0).
To paraphrase Eric Basmajian in his great article (link HERE)“To combat the natural drag that comes with worsening demographics, like most other advanced economies, the United States has decided to massively increase debt to offset this natural drag rather than accept the destiny of demographics.”
Okay, before I go overboard I want to explain one last but very important concept: the wealth effect.
The wealth illusion is a phenomena conditioned into us since the creation of the credit regime - Numbers go up has become normalcy.
Taking high leverage and borrowing cheap credit to buy those assets you always desired created this ever growing wealth illusion and numbers go up paradox. This is facilitated by the secular downtrend of the interest rates figure 5.0 (black line) to finance the consumer expenditure.
Let’s take buying a house as a hypothetical example to explain the wealth illusion semantics.
I live in Vancouver, BC where the current median price for residential homes is $1,374,500. Ridiculous! To get a historical reference, according to the “MLSLink® Housing Price Index (HPI), the benchmark price for all residential properties in Greater Vancouver in 2010 was $579,349”. So in 12 years your initial investment made a whopping 137.25% rise on a relative basis, that’s $795,151.00 dollars in your bank account…. I’ll let you take that in. Millionaires made out of thin air.

However, given that the prices of these homes rose at such a rate. Lowering interest rates was structurally implemented to accommodate the expansional increase of asset prices. So just as an assumption, a house 20 years ago worth $300,000 with a mortgage rate of 10% was nearly as affordable as a house double that price with a lower interest payment.
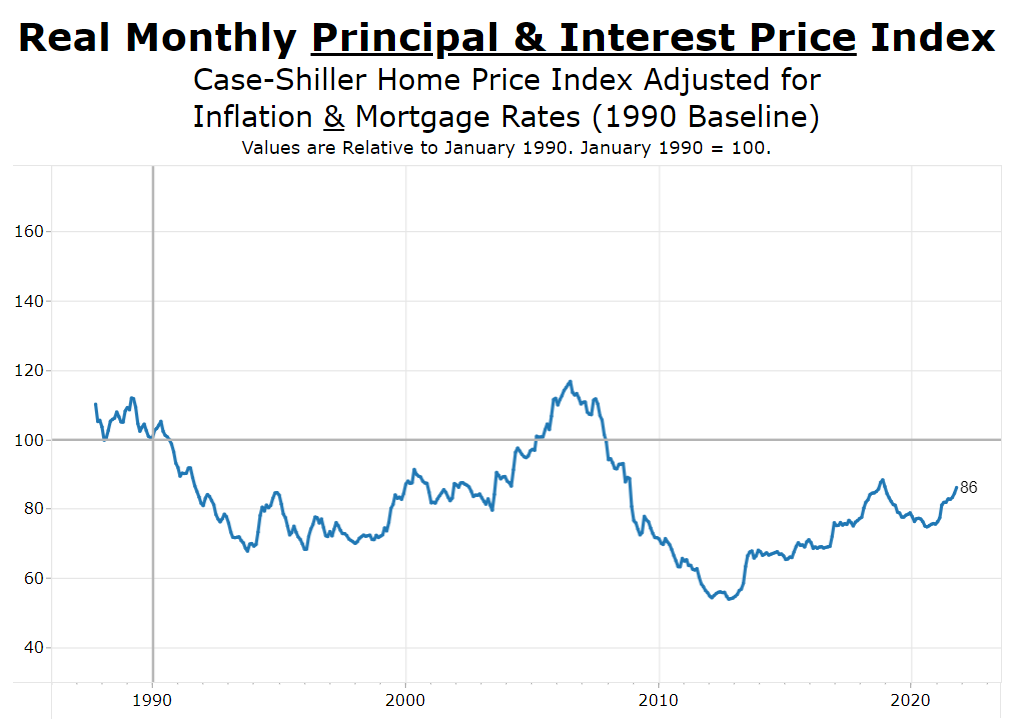
Alfonso in the article - The Macro EndGame (Link HERE) drives home this concept of wealth illusion perfectly. The article presents the data of “US case-shiller Home Price Index which has gone up 258% (!) since 1990 but once you adjust it for inflation and the drop in mortgage rates, here is what you get”. (2022). It tells you one very pivotal factor. Realestate has exceeded the amount of debt availability and the cost to service that debt - the balance between the two is disproportional.
Is that construct normal?
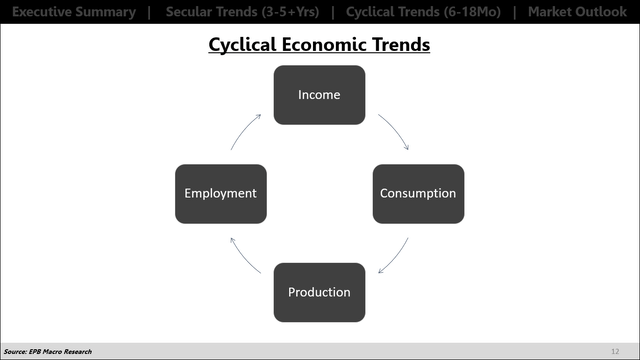
It would be if there was a increase in real global productivity, real GDP growth and many other pivotal factors of cyclical economic growth supporting this circle of economic life. - depicted in Eric Basmajian’s article.
But now that we talked about how we reached this apex of unserviceable debt…. what next? What to do about it?
One of the things the FED is doing to offset this wealth effect and finance debt is through Quantitative Tightening (QT). Which can can slow down borrowing and lending channels but that takes a while because a lot of the corporations are tied to fixed rates. Until they reset and finance their debt there won’t be any major changes.
The most immediate impact is to reverse the wealth effect. The question comes down to: where has credit and liquid created imbalances amongst people and investors? What projects need to be liquidated to take back money back into the real economic growth cycle?
Conclusion & Topics to Discuss in the Future
This is a topic I will be diving into further in detail to drive home the picture of what we are currently witnessing today - the tides are changing. Just remember, you may be biased to the last decade, if that decade conditioned you to associate the current credit based system with wealth. That is why it is paramount to understand the flow of liquidity and the design of our credit based system.
I will be expanding on these concepts as I continue my research.
I will be discussing in depth concepts from this article and about other topics that may interest you like: secular and cyclical trends in the economy, the credit system in depth, bitcoin, cryptocurrency and many more topics that will interest you.
If you have any questions please feel free to critique my work, I want to learn from the reader what I can do to improve your understanding.
If you feel this has helped in way, share with other your fellow humans!
Best Regards,
NeuroInvest Analytics
References
https://advisor.visualcapitalist.com/u-s-stock-ownership-over-time/
https://medium.com/@alex.domash/the-relation-between-nominal-and-real-wage-growth-2bfd2e1b27b8
https://fredblog.stlouisfed.org/
https://www.lynalden.com/does-the-national-debt-matter/
https://www.sifma.org/wp-content/uploads/2017/08/US-Repo-Factsheet-2017-07-25.pdf
Https://themacroompass.substack.com
https://www.epbmacroresearch.com/blog/framework
My own data is collected from Tradeview and FRED data
Great work, easy to read and I really enjoyed reading this.
Great read. Well written and easy to read! Highly recommended to anyone.