


Market Cap Inflections in need of Mathematic Corrections - [ NVDA $ >= NVDA IV ] ?
Market Cap Inflections in need of Mathematic Corrections - [ NVDA $ >= NVDA IV ] ?
Is a company like NVDA likely to sustain its market value? This article dissects the fundamental dissonance between intrinsic valuations and market value - NVDA in today's spotlight.

Few understand that a stock’s current market price is not directly representative of its intrinsic value. Market cap is only a snapshot of a company’s size. It is calculated by multiplying the current market price per share by the total outstanding shares, but this formula lacks the fundamental ‘truths’ that highlight the company’s financial characteristics.
Anyways, that’ll be our quest for today- digging deeper into this concept of valuations- to find bends between reality (intrinsic value) and perception (market price). NVIDIA will be at the core of this discussion.
Inception
The conception of a stock begins when the founders decide to sell their shares of the stock to finance their operations. The initial share price at the time of an initial public offering (IPO) is determined by investment banks or underwriters who handle the IPO process. These banks perform extensive analysis on the company, examining its financials, management, business model, industry, and more to arrive at an initial price per share. This process is also influenced by discussions with potential investors to gauge their interest and willingness to pay for the shares.
Reception
This is where things get finicky. Once exposed to the social world, the life of a stock is influenced by: supply and demand, buyers and sellers placing orders, and the price at which the most recent trade was made. Market participants will keep a close eye on these exogenous forces, hoping place their bids at the right place, right time. ‘
Examples of exogenous influencers:
The company's earnings reports and other financial disclosures
Economic indicators or news
Changes in market sentiment or investor perception of the company or its industry
Global events or news that might affect the overall stock market
Psychological interpretations of the current traded value
At the core of this market consensus price, we have the company’s financial statements. From this, we can determine whether there is truth attached to the current perception of the price.
Mind you, this can go a lot deeper than what i’ll be discussing today.
Introscope
“NVIDIA Corporation, global corporation that manufactures graphics processors, mobile technologies, and desktop computers. The company was founded in 1993 by three American computer scientists, Jen-Hsun Huang, Curtis Priem, and Christopher Malachowsky.”
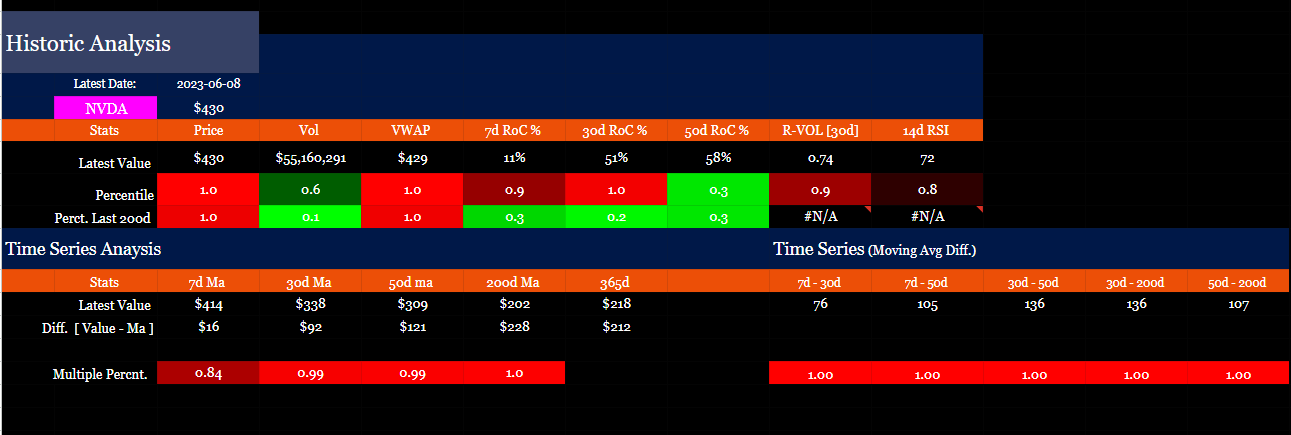
Leading into this last quarters earnings, NVDA’s growth surpassed expectations causing a reflexive upswing, leading the stock price to new all time highs (ATH).
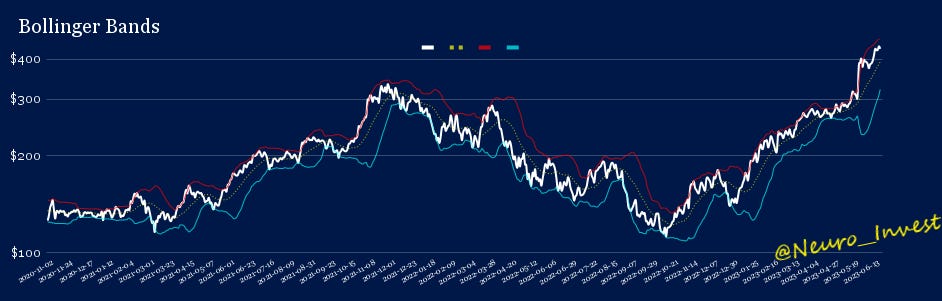
In applying my probabilistic/statistical model to the recent swell in NVDA's market performance, we find ourselves tracing a distinct path along the distribution curve— a schematic that outlines the probability density of various outcomes. Observations of sizable sigma deviations, as quantified through multiple statistical measures, have reached notable historical peaks, suggesting an overextension of market valuation.
However, as we circle back to the initial query, a problem could arise, if we rely solely by looking at the market price. How do we discern if these tail-end outcomes are logistically truthful? Is it not plausible that the financial statement of the company, maintain the pace with the market’s perceived value?
That is where our understanding of the companies financial statements—balance sheet, income statement, and cash flow statement—will prove to be a wealth of information, moving us closer to a logistical fair value. These documents reveal details about a company's revenues, expenses, assets, liabilities, and cash flows, all of which can be used to assess its profitability, liquidity, and solvency.
For those of you unfamiliar with the accounting principals, i’ll attempt to provide more clarity along the way.
Determining Reality
Since it was the earnings that created this reflexive move, lets start there. The growth expectations coincided with the market’s high appraisals. Reported earnings exceeded expectations, for the second quarter of 2024 (Fiscal). In addition, a continuation of rapid growth could continue, if the company can -translate the capital they generated (revenue) into their operations- pay off their liabilities (i.e. debt)- and paying out their shareholders to provide them with comparable returns (i.e. yield).
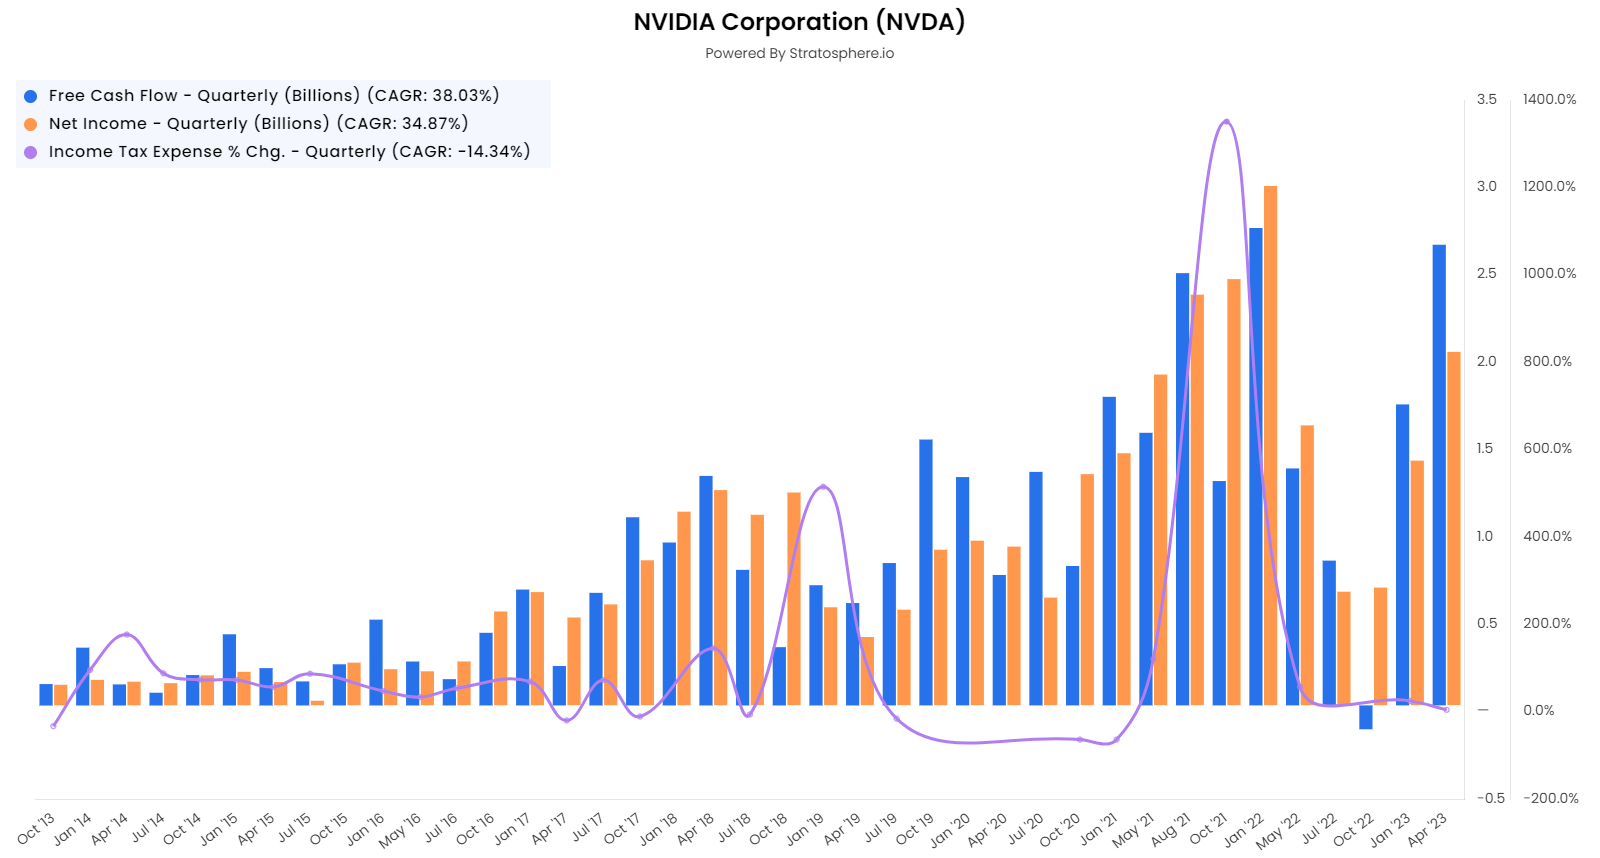
Under the surface, the net income NVDA has produced is structurally sound, earning themselves an annualized CAGR of 22%. From the looks of it they have been able to translate their revenue productively. Giving them the ability to reduce their liabilities, and translate that stream of capital effectively into their profits.
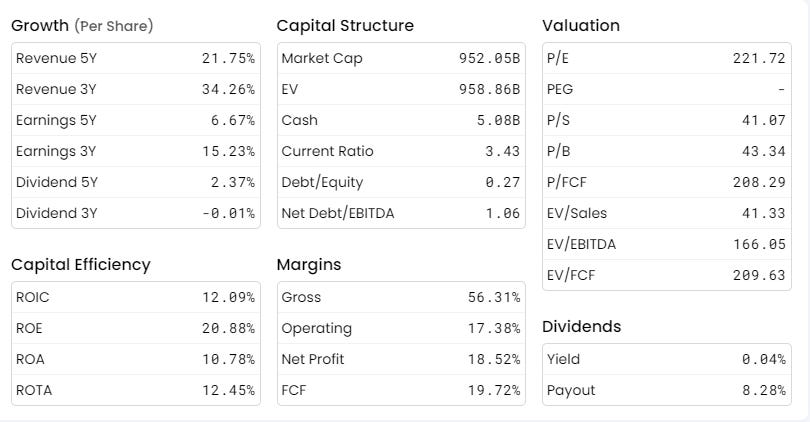
Capital efficiency will help us determine how effectively the company can translate the revenue into profits (ROIC), to pay out the shareholders equity (ROE), or the effectiveness of translating that capital to the overall resources (total assets - ROA).
All meanwhile, NVDA needs to maintain a sound capital structure, which essentially determines the asset to liability mismatch on the companies balance sheet. In other words, examining how well NVDA could produce organic capital, without relying on loads of credit.
Moreover, we’re still left with a perplexing question, does the endogenous financial statement support the vast growth of today's perceived price - the market price. One way we can determine this spread between structure and perception is by analyzing it through a reverse DCF calculation.
Briefly, what is a Discounted cash flow (DCF) model?
The Discounted Cash Flow (DCF) is a valuation method used to estimate the attractiveness of an investment opportunity. It's based on the premise that an asset's value is fundamentally driven by its future cash flows. By forecasting these cash flows and discounting them back to today's value using a rate that reflects the riskiness of the cash flows (the discount rate), the DCF gives an estimate of the intrinsic value of an investment.
Running it through, a DCF model - If we bought today at $426, and you’re desired return (discount rate) is 5%, ceteris peribus, the free cash flow (FCF) would require an annualized trend of 31% to achieve your desired return.
Free Cash Flow (FCF) is a measure of a company's financial performance and health. It represents the cash a company generates after accounting for cash outflows to support operations and maintain its capital assets. Specifically, FCF is calculated by taking a company's operating cash flow and subtracting capital expenditures.
Currently, NVDA’s FCF when looking at the compounded annual growth rate (CAGR) holds a relatively high value at 29%. But, CAGR is an imaginary or geometric average that describes the rate at which an investment would have grown if it had grown at a steady rate, which can be unlikely to happen in reality. The 29% represents the mean annual growth rate of an investment over a specified period. What this tells us, is that growing the FCF at 31% YoY would be difficult to supplement.
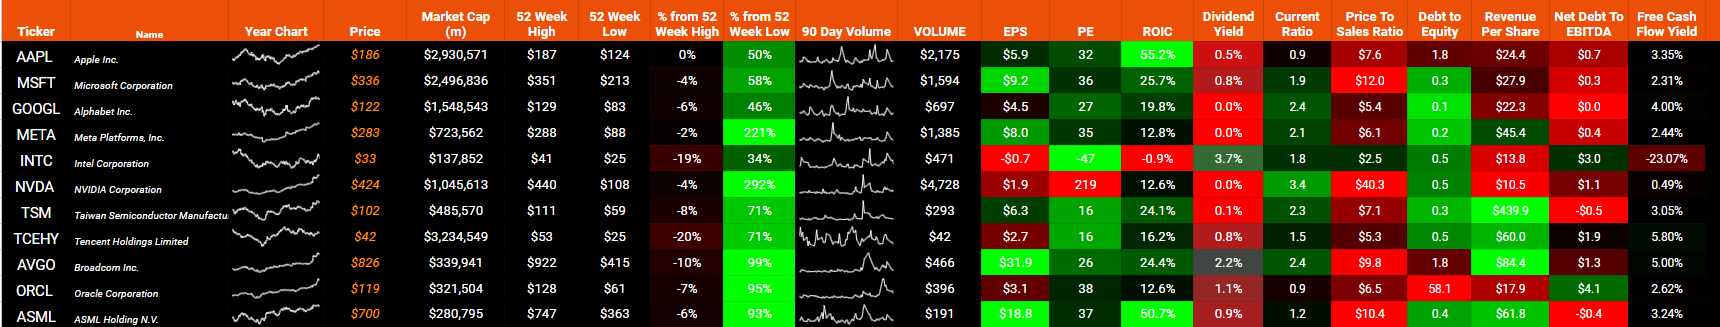
With NVDA up 292% since the 52 week low- trailing price to earnings (PE) and price to Sales ratio going vertical, the market’s consensus price is starting to seem disconnected from reality. It looks like, to a degree, the price could be explained by other factors than the fundamentals.
Synopsis
In any case, the incentives seem obsolete. Especially given an environment where earnings usually collapse, under the weight of credit standards and macroeconomic conditions.
Additionally, the earnings yield, which effectively measures the return on each dollar invested in the company's stock is at .46%. Even if the company continued to surpass the expectations, annualizing a net income of $18bn, gives us a earnings yield just shy of 2%. Comparing that to the risk-free rate on treasuries, which you could currently capture at >5%, well, subsequently impacting the demand for the stock.
Nevertheless, other companies like Tesla battled similar narratives, yet the price inclined even after persistently pessimistic expectations.
Parallels to the .Com Bubble?
Cisco Systems, an American multinational technology company specializing in networking hardware and software, emerged as a titan of the tech industry, thanks to the widespread adoption of the internet and increased demand for networking infrastructure, Cisco's core business.
On March 27, 2000, Cisco Systems reached its peak market capitalization of about $555.4 billion, making it the most valuable company in the world at that time. The company's stock price had soared, reflecting investor optimism about the potential of the internet and tech stocks more broadly.
However, this optimism was unsustainable, and by April 2000, the dot-com bubble began to burst. Over the following year, tech stocks, including Cisco, crashed dramatically as it became clear that the lofty growth expectations could not be met. By the end of 2000, Cisco's stock price had fallen by more than 50% from its peak, and by the end of 2001, the company had lost about 85% of its market value.
Recovery from this dramatic drop was a slow process for Cisco. It took more than a decade for the company's stock price to regain some semblance of stability, and even then, it was far from its peak in the dot-com boom.
This case illustrates the risks of market exuberance and high growth expectations. When a company's stock price disconnects from its fundamental valuation, it can result in a significant correction and long-term impacts for investors.
I hope you enjoyed this article!
Leave a comment below if you’re curious about any company in particular, I’ll definitely be throwing out more of these, with this article as my general blueprint.
Don’t forget to support my work!
Huge thanks to
for providing such useful and powerful information. It’s expanded my knowledge dramatically. In addition, the reverse DCF model is provided in the article below, which will help break down everything you need to know about reverse engineering the stock’s fundamentals.